Exploring the State and Local Roles in Education
From government support to tuition inflation, here’s breakdown of the different education funding sources and their impact on the tri-state region.
Published July 1, 2000
By Frank B. Hicks, Ph.D. and Susan U. Raymond, Ph.D.

Government Support
TREND: A Significant Economic Sector
Based on employment, education is the single largest functional section of government in the region, employing 832,000 workers in 1998. Together, the state and local governments of the Tri-State region spend some $53 billion (6% of the gross regional product) on public education each year.
UPSHOT: Not Short of Resources
The regional pattern is similar to those in states nationwide. So the region’s schools do not seem to suffer from a lack of manpower or funding (see below). If there are improvements to be made, they will most likely need to focus not on increasing resources, but improving the way they are used and distributed.
Public K-12 Spending
TREND: More and More Money…
State and local governments in the region have nearly quadrupled their constant dollar per-pupil resource commitments to public elementary and secondary education in the last four decades. Indeed, New York has quintupled these resources and now spends twice as much per public school student as California.
UPSHOT: Reflects Rising Public Commitment
While debate over the content of the curriculum and the quality of the output persists, there is little question that education’s importance as a community value has become central to public decision making. A recent survey found education to be the #1 voter concern for the upcoming presidential election.
Higher Education
TREND: State Budgets Compare Poorly to Nation
Compared to the national average, the Tri-State region commits only a small fraction of state and local budget resources to higher education. New York’s 4.5% commitment gives it the dubious honor of ranking last in the nation on this measure. But perhaps there is comfort in community: Connecticut ranks 47th and New Jersey 45th.
UPSHOT: Questions About Priorities
If where you put your money reflects what you hold dear, higher education spending may raise questions about state priorities in an increasingly technology-driven economy. All three states are also falling below the national average on state per capita spending on higher education; in Connecticut’s case, nearly 30% below.
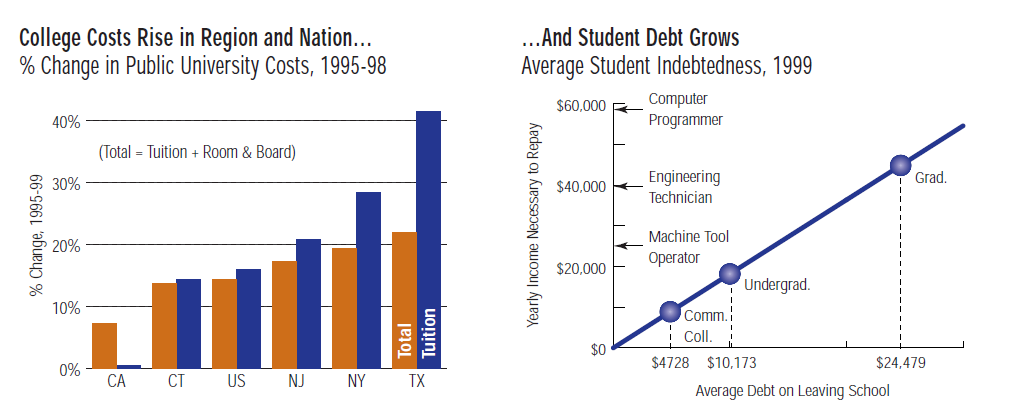
Tuition And Debt Are on The Move (Upward, Of Course)
Tuition inflation, like grade inflation, is no secret. Between 1995 and 1998, the total cost of tuition, room, and board to attend a public college in the Tri-State region rose about 14-19% across the three states. That’s roughly in line with the national average rise of 14%. How are students coping? Analysis of the Stafford federal student loan program indicates that the debt burden of undergraduates in the nation increased by 19% between 1995 and 1999.
Community college students saw an increase of 33%, and most striking, graduate students’ average debt more than doubled. The real affordability story is in the repayment burden. A good rule of thumb is that loan payments shouldn’t be more than 8% of monthly earnings. Today’s buoyant economy seems to be keeping debts in line, although graduate student debt is starting to push precarious heights.
Also read: Community College Output Keeps Pace in Tech Fields
Source
- U.S. Census Bureau, “Statistical Abstract of the United States: 1999”; National Center for Education Statistics, “Digest of Education Statistics 1999.”