
Young violence is a complicated topic with a range of different causes and treatments. Researchers from psychology, sociology, and neurobiology have teamed up to better understand this.
Published June 1, 2004
By Catherine Zandonella
There’s no simple, societal Rx, for preventing violent behavior in children and adolescents. But the latest research findings in psychology, sociology and neurobiology suggest a three-tiered approach to unlocking solutions.
Youth violence plagues society and endangers children throughout much of the United States and the world. Its manifestations cross socio-economic strata, ranging from urban gang violence to school shootings perpetrated by children in middle-class and even upper-income communities.
Yet, the principal method of dealing with youth violence in the United States – punishment through the courts – appears ineffective. Although U.S. crime rates have dropped since 1993, the decline represents a return to a rate that’s much higher than most other Western countries. “We’ve been engaged in an experiment,” said James Gilligan, a prison psychologist at the University of Pennsylvania, “and the results are in: It isn’t working.”
A better approach, one that combines the latest findings in psychology, sociology, and neurobiology, is needed. This was the conclusion of experts from each of these fields who gathered to share information at The New York Academy of Sciences (the Academy) conference, Scientific Approaches to Youth Violence Prevention, held at the Rockefeller University on April 24-26. Instead of punishment, these researchers suggested treating violence less like a moral problem and more like a public health issue that responds to intervention.
A useful approach for thinking about violence intervention is the public health framework: a three-tiered approach that first targets society at large, then susceptible individuals, and finally the afflicted persons. For violence, the first stage involves reducing risk factors such as social inequality, followed by intervention programs for at-risk youth, and thirdly, programs and pharmacotherapeutics for violent offenders
The Social Machinery of Oppression
This framework allows one to consider violence not simply as the physical act of aggression by one person on another, but also the everyday acts of bullying and neglect that can lead to violent behaviors. The framework includes structural violence characterized by economic, political, or social discrimination – in short, the social machinery of oppression.
No single intervention can stop youth violence. Instead, conference organizers arranged the talks around distinct prescriptions that, if all the “medicines” were taken, would decrease violence in society. “We really do believe that if all these (remedies) were followed, we would dramatically reduce violence,” said Donald Pfaff, a neurobiologist at the Rockefeller University in New York and one of the conference organizers.
Primary Prevention: Addressing Social Inequity
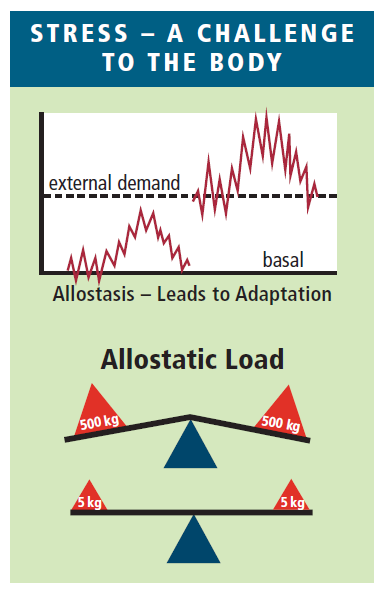
Violence can be traced to many causes, but societal inequity is perhaps the broadest root cause, said Richard Wilkinson, an epidemiologist at the University of Nottingham Medical School, England, who is renowned for his work on socioeconomic disparities and health. As societal inequalities increase, more and more people experience a sense of powerlessness and humiliation – and increasing stress – each of which may trigger violence.
Extreme social inequality can lead to acceptance of violent behaviors, including infanticide and genocide, said medical anthropologist Nancy Scheper-Hughes of the University of California, Berkeley. Scheper-Hughes found that extremely poor Brazilian mothers invested little nurturing in their children and sometimes had to choose which ones would live. Brazilian society, she found, sometimes condoned the murder of street children because they were seen as “rubbish people.”
The School-to-Prison Pipeline
Oversized school populations also are seen as a breeding ground for youth violence. While schools with several thousand students are common in much of the United States, John Devine, a conference organizer and researcher at the Center for Social and Emotional Education in New York, says these large institutions can lead to a “school-to-prison pipeline.”
At the same time, the increased militarization of schools – the presence of metal detectors, surveillance cameras, and police officers patrolling hallways – serves to further the sense of victimization among the students. A better prescription would be smaller, less militarized schools in which teachers and counselors devote more time to communicating with students, offering greater opportunities for positive visions of development.
One reason schools are so important is that early childhood has a major impact on behavior and the developing brain. “Children as young as two years show dominance hierarchies, assuming roles of leaders and followers,” reported W. Thomas Boyce of the School of Public Health at the University of California, Berkeley. Boyce found that about 20% of children are physiologically “highly reactive” to stressful situations, making them more likely to become either victims or perpetrators of violence.
Boys as young as four and five years are primed for aggression, said William Pollack of Harvard Medical School, when society tells them to suppress their emotions — by being told “boys don’t cry.” Pollack is working with boys to develop new “initiation rites” that encourage “healthy vulnerability,” sustained through connection to caring adults, rather than a classic belief in stoicism.
A Supportive Environment for Girls
New York University Professor Carol Gilligan reported on the female equivalent of these rites of passage. Girls are socialized between the ages of nine to 13 to silence their honest “inner voices” and conform to their perceived expectations of boys, girlfriends, parents, and society at large. Instead, said Gilligan, “we need to offer girls a supportive environment to be themselves.”
Sensitivity to the experiences of pubertal girls can help reduce violence against them, reported Holly Foster, a sociologist at Texas A&M University. She found that early onset of puberty was linked to increased verbal and physical abuse from boyfriends.
Instead of targeting all violence, a more cost-effective approach would be to target the most lethal forms of violence. “Why pick up the whole dog just to wag its tail?” asked Franklin Zimring of the School of Law at the University of California, Berkeley. Instead, Zimring suggests that since the majority of homicides are committed with guns, stricter gun laws and enforcement would reduce the death toll of youth violence.
The role of the mother or primary caregiver in the development of an individual at risk for violent behavior is becoming clearer from animal studies. In rats, maternal licking and grooming of pups in the first few days of life are critical to the creation of lasting patterns of neural development, conferring nurturing behavior when the pups reach adulthood, found Michael Meaney, a neuropsychologist at McGill University in Montreal.
Providing the bridge from rats to humans, Peter Fonagy of the University College London said that negative mothering is a major determinant of violence in children.
The Role of the Bystander
Unfortunately, many youth violence-prevention programs are unproven – some are even counterproductive, reported Peter Greenwood, former RAND employee who is now a violence prevention consultant. “What’s common in the most successful programs is they don’t focus on the child, rather they focus on the home environment and the mother or primary caregiver,” he said.
While the Bullying Prevention Program has been proven effective, many such programs ignore a crucial component – the role of the bystander, noted Stuart Twemlow of the Menninger Department of Psychiatry at the Baylor College of Medicine in Houston. Bullying is not exclusively a human activity. Chimpanzees form groups and engage in violence against one another to both enhance their social status and thwart bullying, said Harvard University anthropologist Richard Wrangham.
Turning to the question of how genes interact with environment to produce aggressive behaviors, Donald Pfaff, a neurobiologist at the Rockefeller University, offered an overview of genetic influences on aggression in animals. The effects of genes can depend on when and where in the brain the gene is expressed, the gender and age of the offender, the type of opponent, and the type of aggression.
Twin studies can help distinguish between genetic and environmental determinants of violence, said Essi Viding of the Institute of Psychiatry in London. Viding found that in antisocial 7-year-olds, callous and unemotional traits were about 80% genetic. If these youths can be identified early, perhaps with a genetic test on cells from a cheek swab, one could target programs for them. “Genes are not a blueprint that determines outcome,” said Viding, “but rather they act together with other risk or protective factors to increase or reduce the risk of disorder.”
The Role of Alcohol Use
One well-known risk factor is alcohol use. Alcohol is involved in more than half of all violent assaults. Drinking alcohol relaxes most people, but “a small subpopulation goes berserk,” said Klaus Miczek, professor of psychology and pharmacology at Tufts University in Massachusetts and one of the conference organizers. He believes it may be eventually possible to identify genetic markers in individuals that are prone to aggressive alcohol-related behavior.
Far from deterring violent behavior, punishment is by far the most powerful stimulus of violent behavior, said James Gilligan, a prison psychologist at the University of Pennsylvania and one of the conference organizers. “Today’s prisons treat humans like animals,” said Gilligan, “and then we are surprised when prisoners act like animals.”
Instead, Gilligan advocates the creation of “anti-prisons” – locked, safe, residential settings where prisoners undergo therapeutic and skill-building programs. A successful pilot program in San Francisco reduced the re-arrest rate by 83% among males who attended the program for four months. Support programs for violent individuals make sense because they increase rewards for nonviolent behavior, said Howard Rachlin, a behavioral economist at the State University of New York at Stony Brook.
A variety of drugs can be used to control violent behavior, but all of them were developed to target other afflictions. These include mood stabilizers such as lithium, antidepressants like SSRIs (serotonin selective reuptake inhibitors), Ritalin, beta-blockers such as propranolol, and anti-epileptic drugs. Antiandrogens can control sexual impulses, but they don’t work in all individuals and suffer from low compliance.
Adolescence: The Last Window of Intervention
Finding new drugs is complicated by the fact that violence is classified as symptom rather than a disease, presenting regulatory hurdles, speaker Berend Olivier of Utrecht University in the Netherlands reported. In studies of the numerous neurotransmitters involved, what has been missed, added Klaus Miczek, is careful attention to when these chemicals come into play. For example, serotonin levels drop after aggression initiation. Dopamine levels rise after the behavior terminates, while corticosterone levels dictate termination of violence and recovery.
“We are all looking forward to the era when we can prescribe medications based on the patient’s genotype,” said Jan Volavka, an expert on the neurobiology of violence at the Nathan Kline Institute at New York University. He discussed two promising routes to this goal. A genetic test could determine which individuals have low levels of the enzyme catechol-o-methyltransferase (COMT), making them more prone to violence. A second test could look for low levels of the enzyme monoamine oxidase A (MAOA). If children with low MAOA are subject to maltreatment, they have higher risk of antisocial behavior. However, these children turned out fine if raised in a nurturing environment.
Androgenic hormones clearly predispose to aggressive behaviors in a wide variety of animals and in humans. Alarmingly, anabolic androgenic steroids (AAS) — popular amongst teens for muscle building — may have lasting harmful effects in the brain, said Marilyn McGinnis of the University of Texas, San Antonio.
Both positive and negative experiences during adolescence can have a lasting effect because the brain is so plastic, said Ronald Dahl, an adolescent psychiatrist at the University of Pittsburgh Medical Center and the conference’s keynote speaker. For youths already disposed to violence, said Dahl, adolescence could be a “last window” of intervention.
Also read: Mind, Brain, and Society: The Biology of Violence


