
The Economics of the Region’s Energy Consumption

A close up shot of the top of the powerlines, with a clean blue sky in the background.

An economic and usage analysis of utility consumption in the tri-state region as well as the potential impact of regulation on prices for residential consumers.

Published July 1, 2001

By Allison L. C. de Cerreño, Ph.D., Mahmud Farooque, and Veronica Hendrickson

Image courtesy of lkpro via stock.adobe.com.

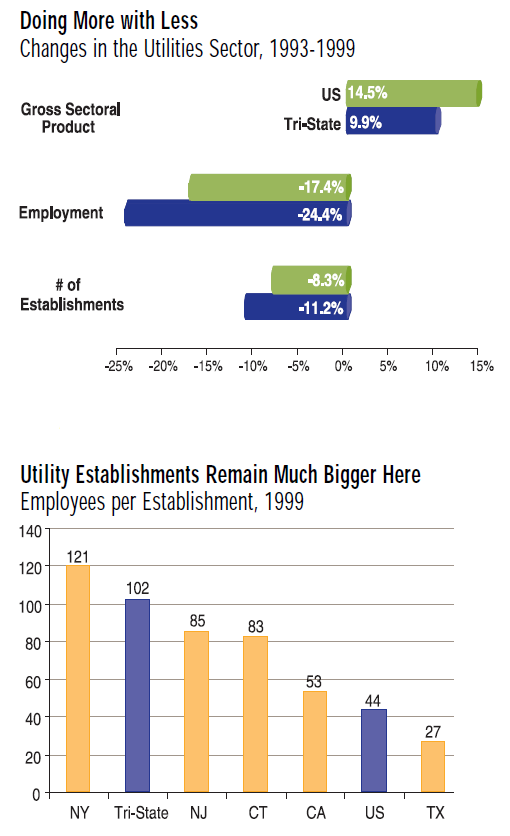
Energy supply is not all that has become scarce in the utilities industry. There are fewer establishments and even fewer employees than there were a decade ago. In spite of this tapering of the labor market, sectoral output in the United States has gone up steadily, increasing by close to 15% between 1993 and 1999. The Tri-State region has followed the national pattern in reduction of workforce and rise in output. However, sectoral product grew rather slowly while there was a sharper decline in the employment base.

The greater loss in jobs is partly due to the fact that establishments in the region are larger than other parts of the country. Although the NY/NJ/CT region represented only 5% of the nation’s utility establishments in 1999, it accounted for 11% of the total employment and 13% of the annual payroll. Utility establishments in the Tri-State region employ on average nearly twice as many people as their counterparts in California; nearly four times as many as in Texas.

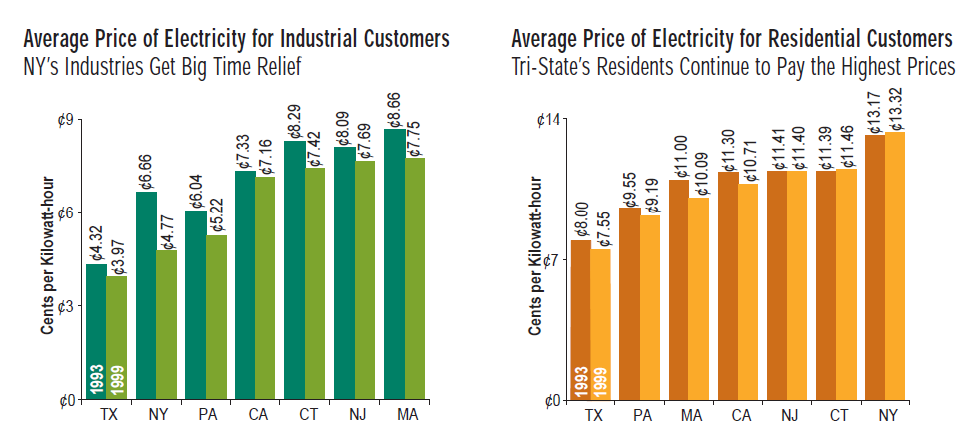
Unbundling of the electric utilities in the 1990s has made the sector more efficient and productive. However, unlike the cases in the airline and telecommunication industries, deregulation is yet to bring a dramatic reduction in the price of electricity, especially for residential customers

Water Utilities: Projections are Up, but Who Will Pay?

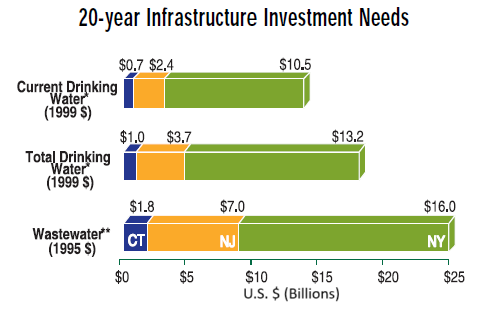
New regulation and improved technology have produced the opposite effect on the region’s employment in the water supply and sanitary services industries. An increase in the number of contaminants that must be monitored and treated has prompted the Bureau of Labor Statistics to project a 34% increase in employment between 1998 and 2008. However, the price tag for required maintenance and regulatory compliance for the region is hefty: about $25 billion for wastewater and $18 billion for drinking water, accounting for 18% and 13% of the United States’ totals respectively.

Energy Consumption in the Tri-State Region

Efficient

In 1999, 14% of the nation’s population resided in the NY/NJ/CT region but accounted for only 8% of the U.S.’s total energy consumption, a rather significant difference. Without the region, per capita energy consumption in the country would increase by more than 3%. Had the Tri-State region’s population consumed energy at the same rate as the rest of the U.S., the total energy usage would have increased by 3010 trillion Btu – more than the total energy consumed in Georgia that year.

Balanced…

Nationally, industrial demand led all other sectors in terms of energy consumption, accounting for 37% of the total energy consumed in 1999. Commercial demand, at 16% of the total, was the lowest of all four sectors. The pattern is similar to that of the Tri- State region, but some thirty years ago. Industrial sector’s share of the total energy pie has been decreasing steadily in the region. Today, each of the four sectors (industrial, commercial, residential and transportation) consumes about a quarter of the total energy.

However, these shifts have not been uniformly distributed across the region. For example, between 1993 and 1999, industrial demand in NY and CT rose by 23% and 5% respectively, but in NJ it dropped by 2%. This loss in industrial demand for energy was more than compensated by a 2.6% increase in the residential sector in a period when New Jersey saw its resident population increase by 3.4%.

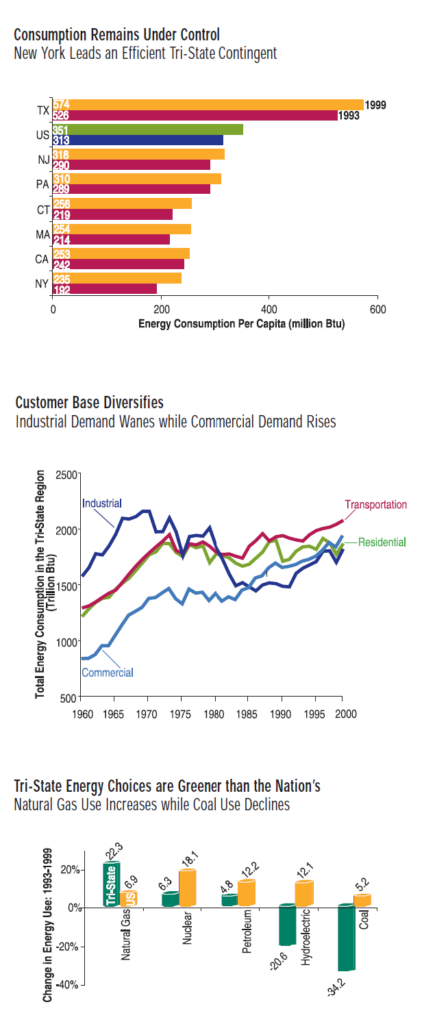
And Environment-Friendly…

Coal provided 20% of the region’s total energy in 1960, a share that dropped to just 3% in 1999. Nationally, consumption of coal continued to hover around the 20% mark, remaining essentially unchanged in the last four decades. Share of natural gas in the NY/NJ/CT region doubled, while nationally, it experienced a 4% decrease from its 1960 levels. Nearly 83% of the total energy consumed in the U.S. came from just three sources: petroleum, natural gas and coal. By contrast, these three accounted for 73% of the total energy consumed in the region, with the remainder coming from hydroelectricity, nuclear, and other sources.

Also read: New York’s Power Woes and Deregulation’s Impact

Sources

  • United States Census Bureau, County Business Patterns, 1993-1999
  • United States Department of Commerce, Bureau of Economic Analysis, Gross State Product Data, 1993-1999.
  • United States Census Bureau, County Business Patterns, 1993-1999.
  • United States Environmental Protection Agency, 1999 Drinking Water Infrastructure Needs Survey.
  • United States Environmental Protection Agency, 1996 Clean Water Needs Survey.
  • United States Department of Energy, Energy Information Administration, State Energy Data Report, 1999.

New York’s Power Woes and Deregulation’s Impact

Powerlines in the foreground with a sunrise/sunset in the background.

Energy demands are on the rise in the tri-state region, and funding is more important than ever for the necessary infrastructure upgrades.

Published July 1, 2001

By Allison L. C. de Cerreño, Ph.D., Mahmud Farooque, and Veronica Hendrickson

Image courtesy of yelantsevv via stock.adobe.com.

In-State Generation

TREND: Increasing Demand, Dwindling Reserves

A generation reserve margin of 18% of peak load is recommended to ensure reliable and continuous power supply for NY. Peak demand has been rising at a rate between 1.2 to 1.4 percent per year while generation capacity has remained fixed at its 1999 levels.

IMPACT: More Dependence, More Problems

In-state reserve margins will shrink from a current 14.9% above peak to a dangerously low 8.4% by 2005 without any new generation. Electricity from out-of-state sources, currently at 3%, will have to make up the deficit, making NY’s power system vulnerable to meteorological, technological, financial and political uncertainties of neighboring regions. Out of commission dirtier in-state units and backup diesel generators will need to be brought back on-line, worsening the current levels of CO2, SO2 and NOx emissions.

Power Grid

TREND: Alone and Caught in the Red

Bureaucratic and political opposition has stalled construction as well as replacement of power lines in NY, leading to a near 10% reduction in circuit miles between 1993 and 1998. Unlike NJ and CT, which belong to regional transmission organizations, NY stands alone, and therefore, plans alone to mitigate its overloaded conditions.

IMPACT: At Capacity and Skating on Overload

Wholesale buying and selling of power requires complex, crisscrossing flows of electricity over long distances. Imported power from Canada is sent via one 300 kilometer 345kV line running from Marcy to New York City. It is at capacity 25% of the time and skating within 100 megawatts of overload for much of the rest. The blackout of 1965 resulted from the loss of a single 345kV line that routed power from Niagara to New York City.

New York City and Long Island

TREND: Demand Grows, Capacity Stays Constant

NYC and LI have become “load pockets”: areas where the import capability of the transmission system, together with the local generation capacity, is insufficient to meet electricity demand at all times. Local generation is required to be at a minimum 80% and 98% of the projected peak in NYC and LI respectively.

IMPACT: Need “In-city” and “On-island” Generation

Between 2001 and 2005 the peak demand will likely increase close to 6%. NYC and LI are running a current deficit of 397 and 131 MW respectively in local generation capacity, which would rise in the coming years unless new plants are built.

What Deregulation Promised: Industry Begins to Get Price Relief while Residents Wait

Deregulation of the airline industry in 1978 brought dramatic reductions in airfare. Between 1980 and 1990, average passenger fares fell by 28%. Unbundling of the local telephone service from long-distance in 1982 also triggered increased competition in the telecommunications industry and drastic reduction in price.

Deregulation of the electric utility industry, initiated through the 1992 Energy Policy Act, is beginning to bring significant rate reductions for industrial customers, though not so much so for residential customers, particularly in the Tri-State region. Between 1993 and 1999, average price for electricity in the region in current dollars dropped by 13.7% for industrial customers but increased by 0.6% for residential customers.

Also read: The Economics of the Region’s Energy Consumption

Sources

  • Edison Electric Institute, Statistical Year Book, 1993-2000; New York Independent System Operator, Power Alert: New York’s Energy Crossroads, March 2001
  • Bureau of Transportation Statistics, National Transportation Statistics, 2000; Energy Information Administration, Electric Power Annuals, 1993-1999
  • Federal Communications Commission, Trends in Telephone Service, 2000

The Collective Approach to Harnessing Technology

A hand-drawn illustration of a woman smiling.

Efforts like the Academy’s Technology in Economic Development initiative aims to advance economic development in the tri-stat region through technology.

Published March 1, 2000

By Fred Moreno, Anne de León, and Jennifer Tang

If, as the saying goes, two heads are better than one, imagine the potential for getting things done that 1,079 companies can have—all focused on advancing New Jersey as a leading technology center. As members of the New Jersey Technology Council (NJTC), these companies share the unwavering commitment of Maxine Ballen to the efficacy of cooperative action.

“We can get more done collectively than individually,” says Ballen. After years of working with high-tech companies on an individual basis, she founded the NJTC in 1996 “to provide networking opportunities, information, and other services to foster the growth of the state’s technology businesses.”

It’s easy to see why Ballen’s role in The New York Academy of Sciences’ (the Academy’s) Technology in Economic Development (TED) project is a good fit. The focus of the TED project, a five-year effort made possible by a grant from the Starr Foundation, is not unlike that of NJTC. With TED, the Academy aims to create a leadership network that will promote rising global competitiveness in the tri-state region through technology-led economic growth. The rationale for the project? The collective assets of the region comprise a far more attractive lure to potential investors than the assets of any individual state.

Lessons for Successful Economic Development

Moreover, Academy studies of global trends during the 1990s revealed “lessons” for successful economic development—which the region is not yet applying.

The TED project has two goals: serve as a mechanism for regularly gathering leaders from industry, academe, and government sectors to create opportunities for improved economic strategies; and develop and share information that can lead to action by tracing trends in science and technology related to economic development.

Asked by the Academy to organize workshops to examine the relationships between universities and industry and workforce development, Ballen did what comes naturally: she pulled together many of the major players in New Jersey.

“We need to show the rest of the country that this is a high-tech region,” Ballen says. “I applaud the Academy for taking the leadership in doing so.”

Also read: The Economics of Transportation and Communications