The Academy’s new home features elegant architecture, intriguing conceptual art, and advanced environmental and safety engineering.
Published July 1, 2006
By Glenn Collins
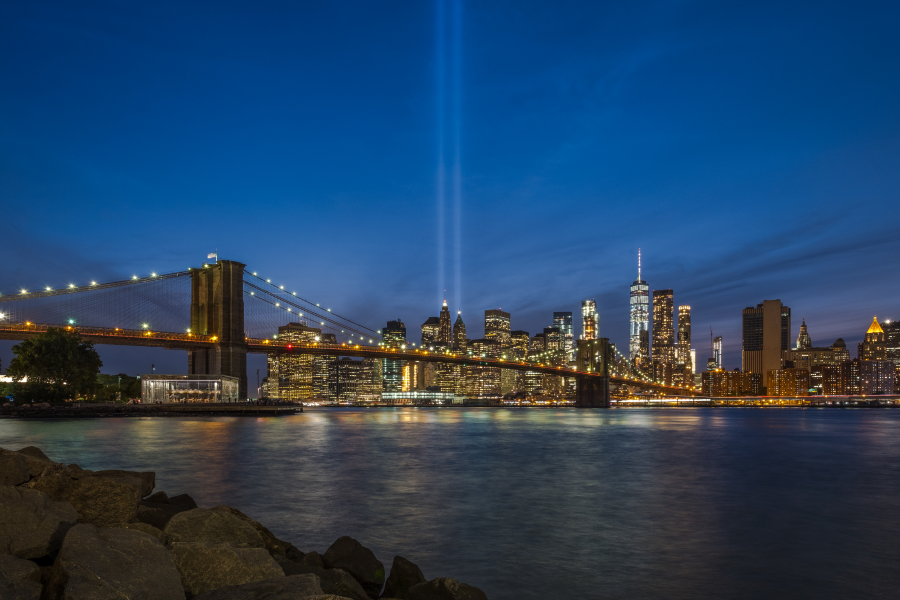
7 World Trade Center was the last tower to fall on September 11, 2001, and the first to be reborn at Ground Zero. This shimmering, sharp-edged, 52-story parallelogram redefines the cityscape, and the arrival of new occupants fulfills a dream for those who dealt firsthand with the rubble that preceded it.
Fortunately for incoming tenants—and those from The New York Academy of Sciences (the Academy) will be among the first, following the developer of the building himself, Larry A. Silverstein—there is much more than the burden of memory to be acknowledged. There is also the promise of award-winning new architecture, state-of-the-art design, intricate technological solutions to daunting challenges and constraints, and a tower that is not only more environmentally responsible than any other in the city but, not incidentally, safer than any other as well.
A Poignant Transparency
There’s one aspect of the building—known simply as “Seven” by its designers and builders—that fascinates those who know it well. They call it the “stealth building” because its glass skin scatters light, and at times lets the building, from many different angles, inhabit the boundary between transparent and reflective.
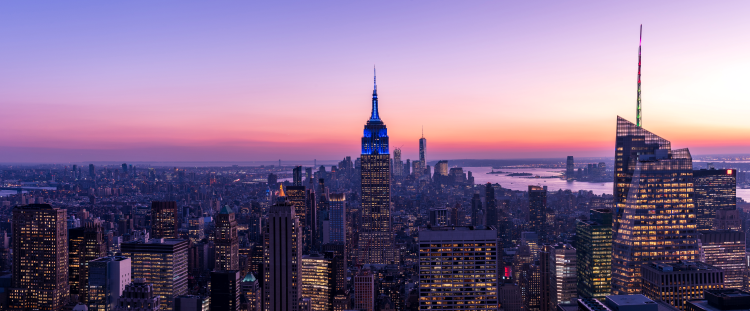
The intensity of this magical effect is greatest in the early morning and late afternoon. Sometimes the shimmering surface takes on a seemingly supernatural glow, especially when viewed from the Hudson River. Its shining aspect changes dramatically during shifting light and varying weather conditions, and at times, when the conditions are perfectly correct, “the elements of the building seem to merge with the sky,” said James Carpenter. He is the glass artist and MacArthur Fellow who helped design Seven, and envisions it as one huge prism.
Despite its eerie transparency, though, it is an office building. And Seven embodies the antithesis of insubstantiality in its vital statistics: it is 741 feet tall, it cost $700 million to build, and has 1.7 million square feet of office space on 42 tenant floors. The tower is sheathed in 538,420 square feet of glass, more than 12 acres. Bounded by Barclay Street on the north, Vesey Street on the south, Washington Street on the west, and Greenwich Street on the east, it is within five minutes of 13 subway lines, the PATH system, and New York Waterway ferries. It takes just one sharp right turn from its doors to reach the West Side Highway.
Zip Code: 10007
But Seven has always been more than just a building. Many of those involved in the new Seven have searing memories of the day when the old one fell, including Mr. Silverstein of Silverstein Properties, the developer of both the original tower and the new one, on land leased from the Port Authority of New York and New Jersey. Mr. Silverstein had a dermatology appointment on September 11, and therefore missed a breakfast meeting in Windows on the World, where no one survived.
Rebuilding Seven was an especially emotional experience for the workers who built it twice, like Elio Cettena and Mike Pinelli, who were onsite supervisors for Tishman Construction Corporation, the construction manager of both the new tower and the old in 1985.
And it is no exaggeration to say that every milestone of the building’s creation was followed avidly, from its November 2003 groundbreaking to its topping-out ceremony on October 21, 2004. Then, after installing 15 tons of steel, the final beam was positioned on the 52nd floor as 500 construction workers, Governor George Pataki, Mayor Michael Bloomberg, and Silverstein looked on. With smiles, salutes, and not a few tears, the steel beam—which was adorned with the same American flag used in the topping-out ceremony for the original 7 World Trade Center—was hoisted 750 feet in the air to its place at the summit of the building.
Gateway to a New Downtown
Back in the clean-up phase after 9/11, open forums had made it clear that the public wanted streets to run through the redeveloped Trade Center site, unlike the former 1960’s design with a “super-block” pedestal that brought street traffic to a dead end. Both community activists and Seven’s lead architect, David Childs of Skidmore, Owings & Merrill, advocated that Silverstein reduce Seven’s footprint to reestablish Greenwich Street, one of the city’s oldest north-south thoroughfares.
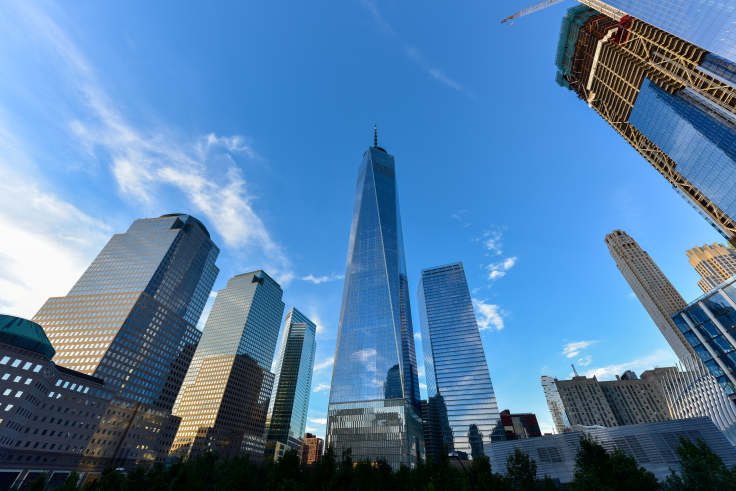
Silverstein acceded. Instead of proceeding directly south on Greenwich Street, travelers will take a jog around a new, triangular, 15,000-square-foot park and pedestrian plaza. Planted with 60 sweetgum trees and boxwood shrubs, the plaza will serve as an amenity to occupants and also, in the words of Childs, “as the gateway to the Trade Center site.” To come is a complex of office towers including the 1776-foot-tall Freedom Tower, a retail center on Church Street, the World Trade Center Memorial , and a commuter station designed by architect Santiago Calatrava. In front of Seven, a short stretch of Greenwich Street will serve as a private drive for taxis and limos.
As for the building itself, Mr. Childs was aiming for “restrained beauty and perfect pitch,” he said, that would derive its effect not only from formal restraint but also from attention to detail.
Lighting the Way
But to do so, the architects had to respond to “a unique set of design challenges,” Silverstein said. Those challenges are so unusual that the building is actually a feat of architectural legerdemain: Childs had to place a delicate skyscraper a top one of the ugliest pedestals in any Manhattan building, a monumental $100 million Con Edison substation.
Sheathed in concrete like the old substation, which was destroyed on September 11, the new substation has three transformers putting out 80 megawatts of power not only for Seven, but also for Battery Park City and, eventually, the buildings of the rebuilt Trade Center site. It can accommodate seven more transformers up to a total of 10, one more than the inventory in the original substation.
The facility, one of 24 substations in Manhattan, reduces 138,000-volt power from generating stations into more manageable, 13,000-volt current distributed to residential and commercial customers. If the $1.1 million, 20-foot-tall, 168-ton transformers are unsightly, then the shifting of the base of the new Seven to the west of the previous Seven (to create the park and reestablish Greenwich Street) made the Con Edison vaults even uglier, because the transformers had to be stacked vertically to save space.
Free Flow of Air
Since the transformers generate heat, they posed another constraint: The wall around them had to permit air to flow freely. Worse, atop the seven-story concrete substation, three floors of the building had to be devoted to mechanical equipment. Rentable offices, therefore, could not be situated until the 11th floor.
While it was obvious that the lower floors had to be clad in some sort of curtain wall (an independently supported outside screen), Childs was adamant that the solution to the quandary of the skyscraper’s base be “something integral, that was designed from the start,” he said, adding that it could not be some fig leaf-like “external piece of art.”
Hoping, as in the haiku and the sonnet, that limitation would be the catalyst for art, Childs sought out Carpenter, a sculptor and architect whose designs have summoned effects from the characteristics of light.
The substation problem came down to one question for Carpenter: “How do you turn an absorptive concrete block,” he asked, “into a reflective, emotive surface?”
A Solution
Carpenter’s solution was to design a sculptural installation for the base of the building, “a stainless-steel scrim that is animated with light,” he said, visually shifting naturally by day with the changing light conditions, and artificially at night with programmed illumination sequences using light-emitting diodes (LEDs). At the same time, the wall could also second as a porous ventilator for the hidden vaults of the three-story transformers, dissipating their heat.
And so, the wall is built of elegantly polished and machined 15-foot-tall, 5-foot-wide panels—each weighing 1500 pounds—of precisely crafted, high-precision triangular steel prism bars set in inner and outer rows.
During the day, these 130,000 prisms reflect ambient light and make the wall an active surface, capturing the sky in different directions, since the prism sections are set off by 15 degrees from each other. “The wall creates a moiré effect that moves by you, as if you are walking past stretched silk,” Childs said.
At night, on the north and south walls, 220,000 blue and white LEDs illuminate the wall of prisms from within, subtly reflecting off the steel and into the street. The diodes are easy to maintain, and give off little heat. At night, 12 motion-sensing cameras are programmed to follow passers-by, marking their passage in columns of multistory blue light on a white ground.
Art and Innovation
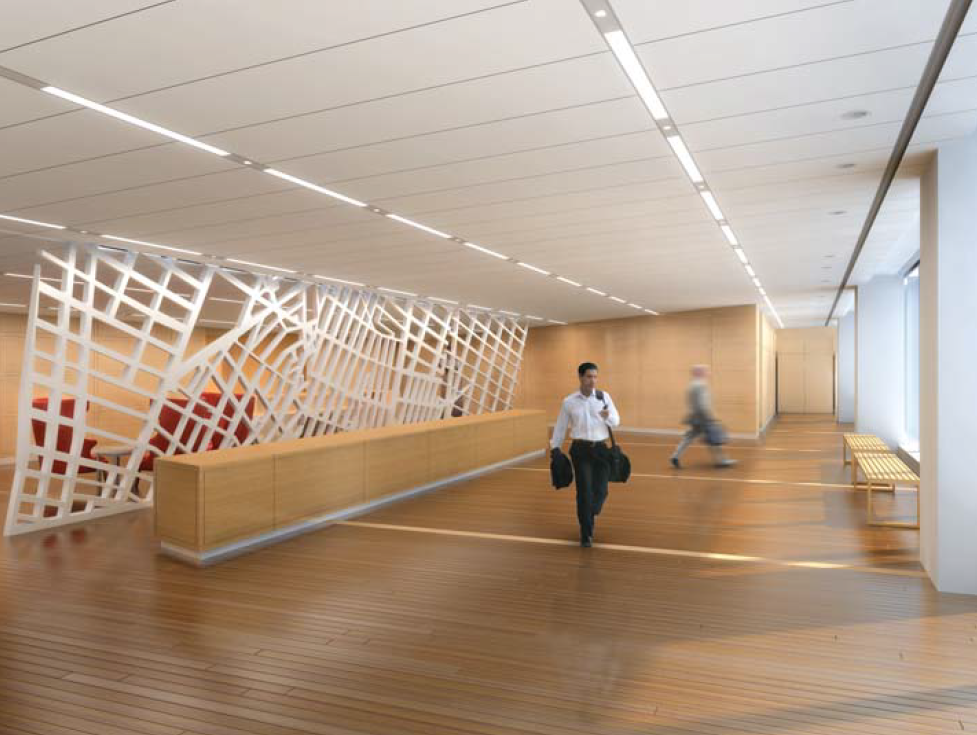
The building lobby, which has the postal address of 250 Greenwich Street, posed another architectural challenge: It had to be sandwiched between two banks of transformer vaults framed by unsightly structural columns five feet in diameter. Childs opened it all up with a street side, 46-foot-tall curtain wall of glass that welcomes daylight into the lobby; he cladded the columns in reflective stainless steel.
Then Childs commissioned an artistic centerpiece: A dominating, floor-to-ceiling, 14-by-65-foot wall of acid-etched translucent glass illuminated by whitish light-emitting diodes, created by Carpenter and the conceptual artist Jenny Holzer. Like Chinese calligraphy, Holzer’s work uses words as art, at the same time as it plays with the power of commercial billboards.
At Seven, she has programmed the wall to display thousands of ghostly white, streaming words of text. This never-ending ribbon of poetry and prose by dozens of authors—from Elizabeth Bishop and Allen Ginsberg to Langston Hughes and Walt Whitman—evokes the history of New York. Though the artwork resides in the lobby, it is visible to pedestrians outside, as well as to those congregating in the Greenwich Street park; it even can be seen blocks away, on Church Street.
The sum of these architectural efforts helped 7 World Trade Center to win a Municipal Art Society annual MASterwork award for urban design this year.
Building Safe
But Seven is far from being just a provocative pretty face. It is also the first office tower in New York City to win gold certification for its green—or environmentally sensitive—architecture, which seeks to reduce energy and natural-resource consumption and lower the building’s impact on the environment. The design incorporates the recycling of rainwater and the use of natural light and air in an interior where toxic materials have largely been eliminated.
Given the building’s location, security was also a crucial concern. “It was a challenge to put an office building on top of a power substation, but it was equally a challenge, if not more so, to create a building that would be safe—safer than anything that had previously been built,” said Silvian Marcus, chief executive officer of WSP Cantor Seinuk, the building’s structural engineers. For its work on 7 World Trade Center, his company recently won the 2006 award for engineering excellence from the New York Association of Consulting Engineers.
Marcus said that Seven’s steel framing “has sufficient redundancy to prevent a progressive collapse,” which was the failing of the Trade Center towers. Nevertheless, “the framing could not interfere with the exterior look of the building, so we tried to make the framing invisible,” he said.
The Bulky Base
Among the building’s security consultants was an Israeli firm experienced in blast effects. Ironically, the bulky base of 7 World Trade Center dramatically enhances its safety, security experts say, since its tenant space starts at the 11th floor above grade, well above immediate street-level blast effects from vehicle-borne explosives. Indeed, the New York Police Department has insisted that the Freedom Tower at Ground Zero—also being designed by Childs—incorporate a similar structurally massive base that is distinctly different from its upper office floors. The designers are likely to use stainless-steel cladding to hide it, adopting design and artistic strategies similar to those pioneered at Seven.
At the base of 7 World Trade Center, the architects have utilized glass, including the 46-foot-high lobby facade, that is laminated with layers of polyvinyl butyral, which stabilizes blast-shattered panes and keeps shards in place. Holzer’s language wall is also a security blanket. Not only does it screen the private precincts of the building, its lamination acts as a blast shield and its high-strength steel members will yield if they counter an explosion.
Massive Concrete Central Core
Further than this, the architects’ principal answer to disaster at Seven is its massive concrete central core, which extends from the base to the top, placing a shield around the stairways, the elevators, sprinkler pipes, and electrical conduits.
The base-to-top core, for the most part two feet thick, is double-constructed with steel reinforcing bars. Its two stairwells will be located at opposite sides of the core, about 110 feet apart, cutting down the possibility that they could be damaged at the same time.
The stairways are oversized, five and a half feet wide—20 percent wider than required by the city code—to permit rapid evacuation. They are fitted with independent emergency lighting and glow-in-the-dark paint and are pressurized to prevent the intrusion of smoke in case of a fire.
The stair landings are extra deep—8 feet by 11 feet—to enable employees in wheelchairs to wait for rescue while the more mobile are able to step past them. The stair treads are wide enough to permit people to walk down, Silverstein said, while emergency workers are walking up. The four fire stairs exit directly to the building’s exterior, preventing bottlenecks or the possible confusion that might result from exits that lead through the main lobby.
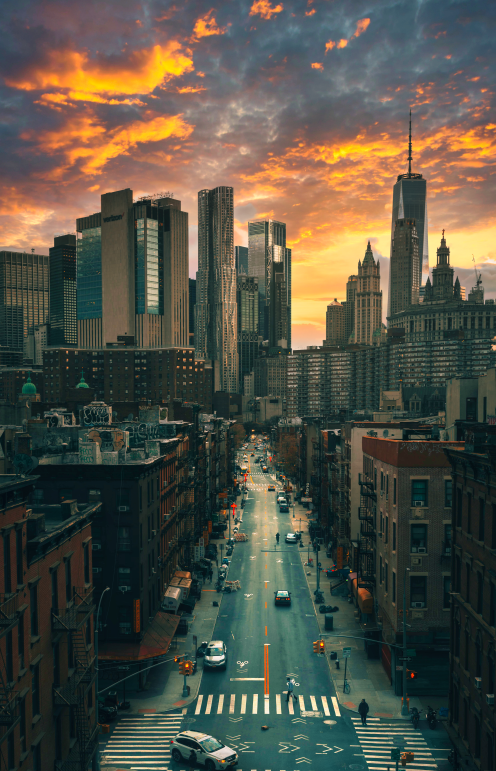
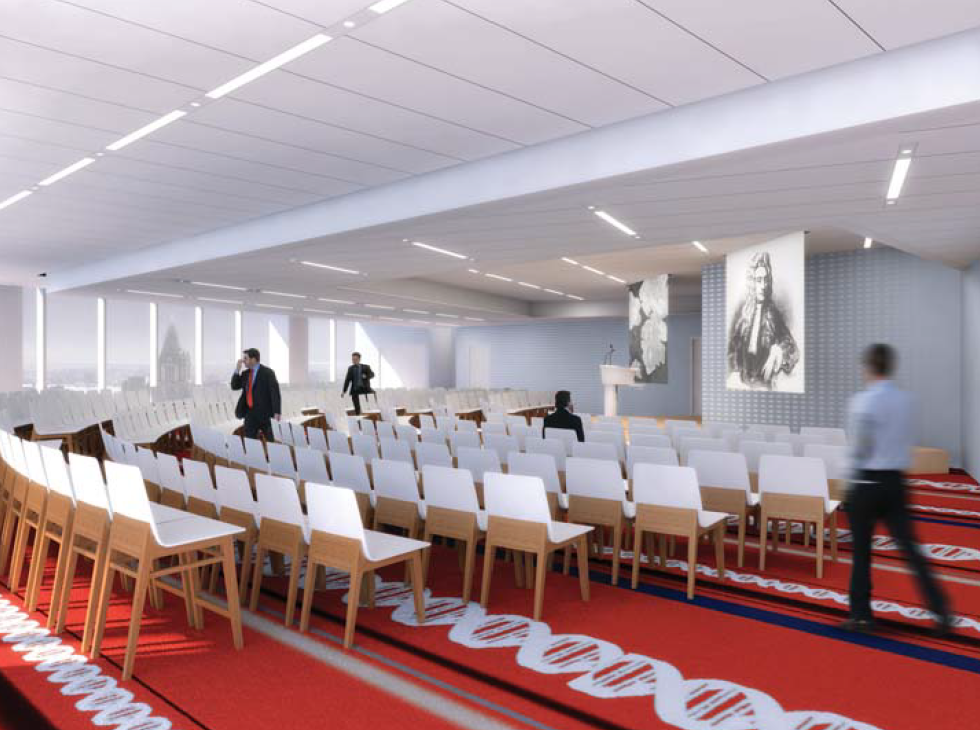
A Renaissance, With a View
The beauty of the execution is that the Academy’s visitors will remain indifferent to all this contingency planning. They can simply enjoy the building’s location, elegant architecture, and the Academy’s striking new offices on the 40th floor. Seven will be a welcoming landmark on the route from trendy Tribeca, with its mix of shopping and restaurants, to the cultural institutions of Lower Manhattan. Looking out the Academy’s office windows, or pausing in Seven’s park, its new tenants will have a privileged close-up view of New York’s oldest neighborhood being made new again.
Also read: Academy’s Past: Where It All Began
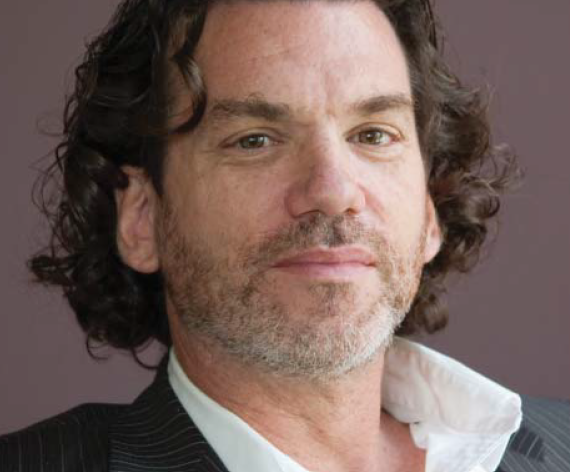
About the Author
Glenn Collins reports on Ground Zero for The New York Times.