
New Frontiers in Computer Visualization

A man works at a computer, working on a 3D rendering of an engineering project.

From 3D models to multimodal “conversation systems” to recreating the “visual complexities” of physical appearance, these researchers are taking computing to the next level.

Published July 1, 2003

By Dan Van Atta

Image courtesy of Framestock via stock.adobe.com.

Three decades ago engineers in California demonstrated a prototype personal computer, called the Alto, that would usher in the PC era and forever alter the course of human communications. In today’s online “e” era, the quest to conquer new challenges in computer science continues at an accelerating pace.

Imagining the potential impacts of today’s research on human activity three decades hence is certainly the creative stimulus of which innovative discovery is made. Three examples of such creative work underway in today’s computer science laboratories were discussed on April 1 at The New York Academy of Sciences’ (the Academy’s) semi-annual Computer Science Mini-Symposium.

Titled Frontiers in Visualization, research scientists from Columbia and Princeton Universities and IBM’s T. J. Watson Research Center each described efforts to create computer-based graphical imaging capabilities that overcome current limitations and open the door to a world of new possibilities.

A Search Engine for 3D Models

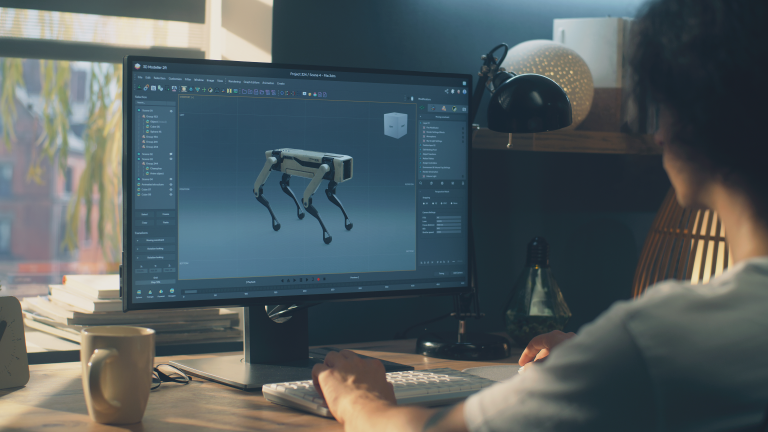
At Princeton University, Thomas Funkhouser, PhD, is working to advance the day when true three-dimensional (3D) models can be readily created electronically and transmitted via the Internet. “Scanners are getting cheaper and fast graphics cards are readily available on PCs,” Funkhouser told the gathering. “Someday 3D models will be as common as images are on the Web today.”

While 3D models already exist on Web sites, Funkhouser said they are often deeply embedded in data and not easy to locate. To remedy this, he and his Princeton colleagues have built a search engine specifically for locating 3D models on the Web.

To locate a 3D model using the search engine, the query can begin with a simple text word, such as “chair.” Or the query can be based on a 2D sketch – a simple drawing of a chair, for example. But the search engine also allows users to scan-in an actual model or sketch and instruct the computer to “find similar shape,” thereby producing a plethora of similarly shaped chairs. The new “query interfaces” they are building also will allow searches based on inputting 3D sketches and models.

“My goal is to create a metric for similarity,” the computer scientist said, “so that we can quickly search the data base and find a similar shape. This requires that we create an index of the data base.”

As an example, Funkhouser described the challenge of asking the search engine to provide the best matches of shapes similar to a 3D image of a Volkswagen Beetle. To accomplish this, he said the team needed to create a “shape descriptor” that would be concise enough to be stored in the data base, compute rapidly and be both efficient and discriminating in its selections.

The Challenges

One challenge is to match 3D models effectively even when they appear in arbitrary alignments. To address this, Funkhouser’s team is building a “harmonic shape descriptor” that is invariant to rotations and yet as discriminating as possible. For this the team decomposes the 3D shapes into “an irreducible set of rotation-independent components,” then stores “how much” of the model resides in each component.

In tests conducted by students at Princeton, Funkhouser said the recently developed search engine proved most effective – 90 percent – when the user query was based on matching to an existing 3D shape. While the engine is still a work in progress, he noted that more than 35,000 3D models have been indexed thus far and more than 260,000 queries were processed this past year.

“This field is so young that there are no real benchmark tests,” Funkhouser added. “We want to develop such a test so that people can test different methods and measure their effectiveness.” Additional work is planned to improve 2D matching methods, develop new query interfaces and new matching and indexing algorithms for better methods of shape matching and shape analysis.

Automating Info Graphics

At IBM’s T. J. Watson Research Center, Michelle Zhou leads a group that is developing next-generation multimodal “conversation systems” to aid users in searching for information. Their system can automatically produce information graphics – such as graphs, charts and diagrams – during the course of “computer-human conversations.”

Zhou, whose PhD dissertation at Columbia was on building automated visualization systems that in turn create a coherent series of animated displays for visualizing a wide variety of information, aims to make these “conversations” both “multimodal,” meaning users can employ both speech and gesture inputs to express their information requests, and “multimedia,” meaning that computers may employ speech, graphics and video to present desired information to users.

When computer users search for information today, such as real estate market trends for a particular area, for example, the desired information needs to be carefully handcrafted using graphics tools such as Microsoft PowerPoint or Adobe Illustrator. Without previous training in graphic design, however, the process of handcrafting such information graphics is difficult and time-consuming. Especially, within a dynamic human-computer conversation, it is extremely difficult to handcraft every possible information graphic in advance.

To simplify matters, researchers have built systems that can help people design information graphics automatically. After receiving a user request – such as “display sales data for the first quarter” – these systems can produce information graphics – such as a bar chart – automatically.

A New Graphics Generation System

Now Zhou and her team are building a new graphics generation system, called IMPROVISE+, that will allow users to provide more specific preferences, then adjust the graphic using a “feedback” input. The result: a new, customized information graphic.

“By allowing users to critique a sketch first,” Zhou said, “IMPROVISE+ can save the cost of fine-tuning the undesirable design.” After the computer processes the initial input to customize the image, however, the human user is once again asked for input. “The system is not foolproof,” Zhou acknowledged, “so at the last stage we take the users input to validate the generation process.”

Selecting from a database of existing graphic examples, or cases, she said the team’s approach uses a “similarity metric” to retrieve the case that is most similar to the request. The retrieved case is then either directly reused or adapted.

“This approach allows us to extend our work to cover a wider variety of applications,” Zhou said, “since existing graphic examples are abundant and the learning process itself doesn’t have to be changed.”

Modeling Visual Appearances

From top: Peter N. Belhumeur, Thomas Funkhouser, and Michelle Zhou.

Computer scientist Peter N. Belhumeur has had a remarkable career since receiving his PhD from Harvard University a decade ago. Recipient of both the Presidential Early Career Award for Scientists and Engineers and the National Science Foundation Career Award, Belhumeur was appointed a full professor of Electrical Engineering at Yale University in 2001.

Belhumeur recently moved to Columbia University, where he is creating computer models that attempt to recreate the “visual complexities” of physical appearance. To do this requires understanding and attempting to replicate the complex variations related to shape, reflection, viewpoint and illumination.

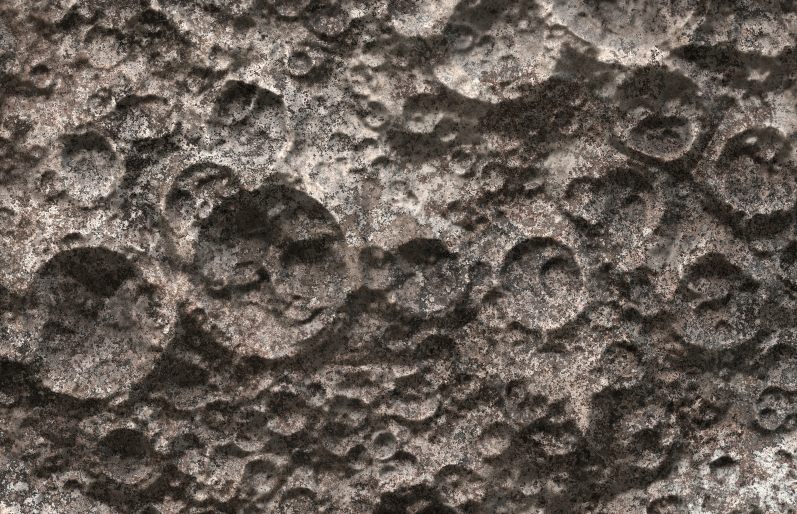
In looking at even very common and seemingly simple images, Belhumeur noted that the differences between the images of the surfaces of the various material elements are quite stunning. “Because of the variation in the composition of the materials,” he said, “there’s really a great disparity in the appearance.”

To accurately model the visual appearance of an object researchers must account for its shape, reflection, viewpoint and illumination. Of the four, Belhumeur said reflectance – a four-dimensional process involving both the incoming and outgoing light – is the most complex and least understood, despite its critical importance. “As a result, you have to make assumptions about the nature of reflectance,” he said, “and this has been sort of the Achilles’ heel of nearly all image-based shape reconstruction.”

Many Applications

Referring to side-by-side photos of a peach and a nectarine, Belhumeur said: “Here you have two objects that are Essentially the same shape and coloration. Yet, because of the differences in reflection, they appear different enough.” That difference, he pointed out, is due to the way the surface of each object reflects light.

Despite the challenges, he said researchers at Columbia have developed a new method for reconstructing models of objects from images of the objects themselves, as well as a new algorithm for determining reflectance. The models will allow scientists to view the shape of the object from a single image, he said, then produce reasonably accurate “synthetic images” showing how the object would look under viewpoints or different lighting conditions.

In addition, the researchers have invented a device called the Lighting Sensitive Display that uses photo-detectors, cameras and optical fibers to sense the illumination in the environment and modify the content of the image. Potential applications of this work, Belhumeur said, include face and object recognition, image-based rendering, computer graphics, content-based image and video compression and human-computer interfaces.

Also read:  IBM Provides Valuable Data and Modeling Tools for Crisis Response


About the Researchers

Peter N. Belhumeur graduated in 1985 from Brown University with Highest Honors, receiving a Sc.B. degree in Computer and Information Engineering. He received a S.M. in 1991 and a Ph.D. in 1993 from Harvard University, where he studied under David Mumford and was supported by a Harvard Fellowship. In 1993 he was a Postdoctoral Fellow at the University of Cambridge’s Sir Isaac Newton Institute for Mathematical Sciences. He was appointed professor of Electrical Engineering at Yale University in 2001. He recently joined the faculty at Columbia University.

Thomas Funkhouser is an assistant professor in the Department of Computer Science at Princeton University. Previously, he was a member of the technical staff at Bell Laboratories. His current research interests include interactive computer graphics, computational geometry, distributed systems, and shape analysis. He received a B.S. in Biological Sciences from Stanford University in 1983, a M.S. in computer science from UCLA in 1989, and a Ph.D. in computer science from UC Berkeley in 1993.

Michelle Zhou is a research staff member at IBM T.J. Watson Research Center, where she manages the group of intelligent multimedia interaction. Before joining IBM, Michelle was working on her thesis at Columbia University on creating automated visualization systems that can create a coherent series of animated displays for visualizing a wide variety of information. She also received a Ph.D. in computer science from Columbia.

Building a Big Future from Small Things

A finger holds a microprocessor to showcase the small size of this technology.

Nanotechnology has potential to revolutionize our daily lives and one aspect that makes this technology so promising and effective is its bottom-up approach.

Published October 1, 2002

By Charles M. Lieber

Nanotechnology has gained widespread recognition with the promise of revolutionizing our future through advances in areas ranging from computing, information storage and communications to biotechnology and medicine. How might one field of study produce such dramatic changes?

At the most obvious level nanotechnology is focused on the science and technology of miniaturization, which is widely recognized as the driving force for the advances made in the microelectronics industry over the past 30 years. However I believe that miniaturization is just one small component of what makes and will make nanoscale science and technology a revolutionary field. Rather, it is the paradigm shift from top-down manufacturing, which has dominated most areas of technology, to a bottom-up approach.

The bottom-up paradigm can be defined simply as one in which functional devices and systems are assembled from well-defined nanoscale building blocks, much like the way nature uses proteins and other macromolecules to construct complex biological systems. The bottom-up approach has the potential to go far beyond the limits of top-down technology by defining key nanometer-scale metrics through synthesis and subsequent assembly – not by lithography.

Producing Structures with Enhanced and New Functions

Of equal importance, bottom-up assembly offers the potential to produce structures with enhanced and/or completely new function. Unlike conventional top-down fabrication, bottom-up assembly makes it possible to combine materials with distinct chemical composition, structure, size and morphology virtually at will. To implement and exploit the potential power of the bottom-up approach requires that three key areas, which are the focus of our ongoing program at Harvard University, be addressed.

First and foremost, the bottom-up approach requires nanoscale building blocks with precisely controlled and tunable chemical composition, structure, morphology and size, since these characteristics determine their corresponding physical (e.g. electronic) properties. From the standpoint of miniaturization, much emphasis has been placed on the use of molecules as building blocks. However, challenges in establishing reliable electrical contact to molecules has limited the development of realistic schemes for scalable interconnection and integration without having key feature sizes being defined by the conventional lithography used to make interconnects.

My own group’s work has been focused on the nanoscale wires and, in particular, semiconductor nanowires as building blocks. This focus was initially motivated by recognition that the one-dimensional nanostructures represent the smallest morphology structure for efficient routing of information – either in the form of electrical or optical signals. Subsequently, we have shown that nanowires can also exhibit a variety of critical device function, and thus can be exploited as both the wiring and device elements in functional nano-systems.

Control Over Nanowire Properties

Currently, semiconductor nanowires can be rationally synthesized in single crystal form with all key parameters – including chemical composition, diameter and length, and doping/electronic properties – controlled. The control that we have over these nanowire properties has correspondingly enabled a wide range of devices and integration strategies to be pursued. For example, semiconductor nanowires have been assembled into nanoscale field-effect transistors, light-emitting diodes, bipolar junction transistors and complementary inverters – components that potentially can be used to assemble a wide range of powerful nano-systems.

Tightly coupled to the development of our nanowire building blocks have been studies of their fundamental properties. Such measurements are critical for defining their limits as existing or completely new types of device elements. We have developed a new strategy for nanoscale transistors, for example, in which one nanowire serves as the conducting channel and the other crossed nanowire as the gate electrode. Significantly, the three critical device metrics are naturally defined at the nanometer scale in assembled crossed nanowire transistors:

(1) a nanoscale channel width determined by the diameter of the active nanowire;

(2) a nanoscale channel length defined by the crossed gate nanowire diameter; and

(3) a nanoscale gate dielectric thickness determined by the nanowire surface oxide.

These distinct nanoscale metrics lead to greatly improved device characteristics such as high gain, high speed and low power dissipation. Moreover, this new approach has enabled highly integrated nanocircuits to be defined by assembly.

Hierarchical Assembly Methods

Second and central to the bottom-up concept has been the development of hierarchical assembly methods that can organize building blocks into integrated structures. Obtaining highly integrated NWs circuits requires techniques to align and assemble them into regular arrays with controlled orientation and spatial location. We have shown that fluidics, in which solutions of nanowires directed in channels over a substrate surface, is a powerful and scalable approach for assembly on multiple-length scales.

In this method, sequential “layers” of different nanowires can be deposited in parallel, crossed and more complex architectures to build up functional systems. In addition, the readily accessible crossed nanowire matrix represents an ideal configuration since the critical device dimension is defined by the nanoscale cross point, and the crossed configuration is a naturally scalable architecture that can enable massive system integration.

Third, combining the advances in nanowire building block synthesis, understanding of fundamental device properties and development of well-defined assembly strategies has allowed us to move well beyond the limit of single devices and begin to tackle the challenging and exciting world of integrated nano-systems. Significantly, high-yield assembly of crossed nanowire structures containing multiple active cross points has led to the bottom-up organization of OR, AND, and NOR logic gates, where the key integration did not depend on lithography. Moreover, we have shown that these nano-logic gates can be interconnected to form circuits and, thereby, carry out primitive computation.

Tremendous Excitement in the Field

Prof. Lieber

These and related advances have created tremendous excitement in the nanotechnology field. But I believe it is the truly unique characteristics of the bottom-up paradigm, such as enabling completely different function through rational substitution of nanowire building blocks in a common assembly scheme, which ultimately could have the biggest impact in the future. The use of modified nanowire surfaces in a crossed nanowire architecture, for example, has recently led to the creation of nanoscale nonvolatile random access memory, where each cross point functions as an independently addressable memory element with a potential for integration at the 1012/cm2 level.

In a completely different area, we have shown that nanowires can serve as nearly universal electrically based detectors of chemical and biological species with the potential to impact research in biology, medical diagnostics and chem/bio-warfare detection. Lastly, and to further highlight this potential, we have shown that nanoscale light-emitting diode arrays with colors spanning the ultraviolet to near-infrared region of the electromagnetic spectrum can be directly assembled from emissive electron-doped binary and ternary semiconductor nanowires crossed with non-emissive hole-doped silicon nanowires. These nanoscale light-emitting diodes can excite emissive molecules for sensing or might be used as single photon sources in quantum communications.

The bottom line – focusing on the diverse science at the nanoscale will provide the basis for enabling truly unique technologies in the future.

Also read: Molecular Manufacturing for the Genomic Age


About the Author

Charles M. Lieber moved to Harvard University in 1991 as a professor of Chemistry and now holds a joint appointment in the Department of Chemistry and Chemical Biology, where he holds the Mark Hyman Chair of Chemistry, and the Division of Engineering and Applied Sciences. He is the principal inventor on more than 15 patents and recently founded a nanotechnology company, NanoSys, Inc.

Molecular Manufacturing for the Genomic Age

A computer chip and similar technology.

Researchers are making significant advances in nanotechnology which someday may help to revolutionize medical science for everything from testing new drugs to cellular repair.

Published October 1, 2002

By Fred Moreno, Dan Van Atta, and Jennifer Tang

When it comes to understanding biology, Professor Carl A. Batt believes that size matters – especially at the Cornell University-based Nanobiotechnology Center that he codirects. Founded in January 2000 by virtue of its designation as a Science and Technology Center, and supported by the National Science Foundation, the center seeks to fuse advances in microchip technology with the study of living systems.

Batt, who is also professor of Food Science at Cornell, recently presented a gathering – entitled Nanotechnology: How Many Angels Can Dance on the Head of a Pin? – with a tiny glimpse into his expanding nano biotech world. The event was organized by The New York Academy of Sciences (the Academy). “A human hair is 100,000-nm wide, the average circuit on a Pentium chip is 180 nm, and a DNA molecule is 2 nm, or two billionths of a meter,” Batt told the audience.

“We’re not yet at the point where we can efficiently and intelligently manipulate single molecules,” he continued, “but that’s the goal. With advances in nanotechnology, we can build wires that are just a few atoms wide.

“Eventually, practical circuits will be made up of series of individual atoms strung together like beads and serving as switches and information storage devices.”

Speed and Resolution

There is a powerful rationale behind Batt’s claim that size is important to the understanding of biology. Nanoscale devices can acquire more information from a small sample with greater speed and at better resolution than their larger counterparts. Further, molecular interactions such as those that induce disease, sustain life and stimulate healing all occur on the nanometer scale, making them resistant to study via conventional biomedical techniques.

“Only devices built to interface on the nanometer scale can hope to probe the mysteries of biology at this level of detail,” Batt said. “Given the present state of the technology, there’s no limit to what we can build. The necessary fabrication skills are all there.”

Scientists like Batt and his colleagues at Cornell and the center’s other academic partners are proceeding into areas previously relegated to science fiction. While their work has a long way to go before there will be virus-sized devices capable of fighting disease and effecting repairs at the cellular level, progress is substantial. Tiny biodegradable sensors, already in development, will analyze pollution levels and measure environmental chemicals at multiple sample points over large distances. Soon, we’ll be able to peer directly into the world of nano-phenomena and understand as never before how proteins fold, how hormones interact with their receptors, and how differences between single nucleotides account for distinctions between individuals and species.

The trick – and the greatest challenge posed by an emerging field that is melding the physical and life sciences in unprecedented ways – is to adapt the “dry,” silicon-based technology of the integrated circuit to the “wet” environment of the living cell.

Bridging the Organic-Inorganic Divide

Nanobiotechnology’s first order of business is to go beyond inorganic materials and construct devices that are biocompatible. Batt names proteins, nucleic acids and other polymers as the appropriate building blocks of the new devices, which will rely on chemistries that bridge the organic and inorganic worlds.

In silicon-based fabrication, some materials that are common in biological systems – sodium, for example – are contaminants. That’s why nano-biotech fabrication must take place in unique facilities designed to accommodate a level of chemical complexity not encountered in the traditional integrated-circuit industry.

But for industry outsiders, the traditional technology is already complex enough. Anna Waldron, the Nanobiotechnology Center’s Director of Education, routinely conducts classes and workshops for schoolchildren, undergraduates and graduates to initiate them into the world of nanotechnology, encourage them to pursue careers in science, and foster science and technology literacy.

In a hands-on presentation originally designed for elementary-school children, Waldron gives the audience a taste – both literally and figuratively – of photolithography, a patterning technique that is the workhorse of the semiconductor industry. Instead of creating a network of wells and channels out of silicon, however, Waldron works her magic on a graham cracker, a chocolate bar and a marshmallow, manufacturing a mouthwatering “nanosmore” chip in a matter of minutes.

Graham crackers are substituted for silicon substrate, while chocolate provides the necessary primer for the surface. Marshmallows act as the photoresist, an organic polymer that, when exposed to light, radiation, or, in this case, a heat gun, can be patterned in the desired manner. Finally, a Teflon “mask” is placed on top of the marshmallow layer and a blast from the heat gun transfers the mask’s design to the marshmallow’s surface – a result that appeared to leave a lasting impression on the Academy audience as well.

What’s Next?

According to Batt, it won’t be too long before the impact of the nanobiotech revolution will be felt in the fields of diagnostics and biomedical research. “Progress in these areas will translate the vast information reservoir of genomics into vital insights that illuminate the relationship between structure and function,” he said.

Prof. Batt

Also down the road, ATP-fueled molecular motors may drive a whole series of ultrasmall, robotic medical devices. A “lab-on-a-chip” will test new drugs, and a “smart pharmacist” will roam the body to detect abnormal chemical signals, calculate drug dosage and dispense medication to molecular targets.

Thus far, however, there are no manmade devices that can correct genetic mutations by cutting and pasting DNA at the 2-nanometer scale. One of the greatest obstacles to their development, Batt said, doesn’t lie in building the devices, but in powering them. Once the right energy sources are identified and channeled, we’ll have a technology that speaks the language of genomics and proteomics, and decodes that language into narratives we can understand.

Also read: Building a Big Future from Small Things


About Prof. Batt

Microbiologist Carl A. Batt is professor of Food Science at Cornell University and co-director of the Nanobiotechnology Center, an NSF-supported Science and Technology Center. He also runs a laboratory that works in partnership with the Ludwig Institute for Cancer Research.

Landing on Eros Unearthed Even More Mysteries

A shot of the pot marked surface of the Moon.

Astronomers had never before found an asteroid that had left the main “belt” between Mars and Jupiter and approached earth’s orbit…until now.

Published March 1, 2002

By Robert Zimmerman

On ordinary days, the control room for a deep-space mission is rather sedate: data stream in, routine commands stream out, no one need raise his voice. But February 12, 2001, was no ordinary day for the technicians controlling NASA’s Near Earth Asteroid Rendezvous (NEAR)-Shoemaker spacecraft. Some punched calculators madly, while others ran from computer monitor to computer monitor, shouting numbers, trying to find out what was happening. Nearby, television crews aimed cameras at the scrambling engineers, capturing their every motion. Pandemonium had replaced the serene orderliness.

The NEAR team had brought this chaos on themselves. In a bold flourish to end their successful mission, the spacecraft’s science and engineering teams at the Johns Hopkins University Applied Physics Lab in Laurel, Maryland, sent NEAR-Shoemaker toward a landing on the surface of Eros, the asteroid it had circled for a year. Never mind that the probe had been built as an orbiter and had no landing mechanism of any kind. Even if NEAR wound up shattering into a thousand pieces, the images it would send in its final moments would make the stunt worthwhile.

Two members of NEAR’s imaging team, Joseph Veverka, professor of astronomy at Cornell University and Mark Robinson of Northwestern University, huddled in front of a computer to marvel at the high-resolution images coming from space. Veverka was amazed by the absence of craters in the close-up pictures of the asteroid’s surface, and Robinson was impressed at the numerous boulders of all shapes and sizes.

Hungrily Consuming Information

The spacecraft descended at a leisurely four miles per hour, and the images grew in detail and complexity. The investigators hungrily consumed each bit of information, fully expecting the data stream to end abruptly at the moment of impact. Several technicians watched as their computer programs counted the altitude down to zero. Then one of the flight engineers yelled, incredulously, “Totally nominal––we’ve got a signal!” Robert Farquhar, the mission director, shouted, “Hold that signal!”

NEAR-Shoemaker had not only touched the surface of Eros, it had come through the impact seemingly whole and in operation. It was as if the controllers had rolled an egg across a gravel field without even cracking the shell. Although no more images could be transmitted, NASA allowed the mission an extension of several weeks to enable the craft to gather and radio back additional data about the chemical make-up of the spacecraft’s landing site.

After accomplishing the first rendezvous with an asteroid, the first orbit of an asteroid and the first landing on an asteroid, the investigators in charge of the NEAR-Shoemaker mission now have compiled a wealth of information about a heretofore shadowy subject –– the bits of planetary debris that inhabit the middle reaches of the solar system.

The data and images from the mission have already helped answer innumerable questions about asteroids and how they figure in the birth and formation of the solar system. But more interesting, perhaps, was what NEAR-Shoemaker did not tell scientists. As extraordinary as the landing was, the last-second images paralleled many of NEAR-Shoemaker’s other discoveries. For every question that was settled, another conundrum was unexpectedly uncovered.

“These [images] leave us with mysteries that will have us scratching our heads for years to come,” Veverka said.

A Place in Space

Even before the NEAR-Shoemaker mission, Eros had been one of the most studied asteroids. Its orbit ranges from 165 million miles to 105 million miles from the sun; that means on occasion it comes within 10 million miles of the earth. Astronomers have long used those close approaches as a valuable measuring stick. The earth’s distance to the sun and the mass of the earth-moon system were measured using positions triangulated with the help of Eros. What’s more, the regular visits enable astronomers to study the asteroid from the earth with relative precision.

The first asteroid was discovered in 1801 by Giuseppe Piazzi, a professor of mathematics and astronomy at the University of Palermo in Sicily. Piazzi had been surveying a part of the solar system between Mars and Jupiter in hopes of spotting a planet thought to lie there. Those hopes were based upon the Titius-Bode Law, a simple mathematical routine that could produce the orbital distance of the first eight planets with surprising accuracy; that law predicted a planet at a distance of 275 million miles.

After tracking a bright object across the background stars for more than a month, Piazzi calculated its position and found that its orbit closely corresponded with the location of the “missing planet.” On February 12, 1801 –– 200 years to the day before NEAR’s landing on Eros –– Piazzi announced his discovery. A new planet had been found, one he called Ceres, after the Roman goddess of the harvest.

A Point in the Sky

Piazzi’s fame was short-lived. Once other astronomers began observing Ceres they discovered that, unlike other planets, this one presented no discernable disk. It was, like a star, a point in the sky. The name “asteroid” (meaning “starlike”) stuck. The next year the German astronomer Heinrich Olbers found another asteroid in much the same orbit as Ceres. Hundreds of asteroids had been spotted by the time the German Gustav Witt and the Frenchman Auguste Charlois independently discovered Eros on the same night in 1898.

Eros, however, marked a first: Astronomers had never before found an asteroid that had left the main “belt” between Mars and Jupiter and approached earth’s orbit. And it is large, measuring some 21 miles long and eight miles wide. Although the total number of known asteroids exceeds 10,000, astronomers have identified only 250 or so near-earth asteroids, as those with orbits like that of Eros’s are called.

No asteroid is known to be on a collision course with earth, but impacts have occurred throughout geological history –– asteroid impacts are implicated in large extinctions and with creating the craters that formed lakes in Canada and elsewhere. Very small bits of asteroids hit the earth all the time. They’re called meteorites once they land.

Geologists have collected thousands of meteorites. Some meteorites are composed of carbon-rich minerals and look like soot; others are almost pure iron. But the majority –– some 80 percent –– are what geologists call ordinary chondrites. Such rocks are stony in appearance and largely made up of silicate ores, such as olivine and pyroxene.

A Model Mission

Rather than get fleeting images of many asteroids, the NEAR mission, launched in 1996, was designed to gain an extraordinary amount of information about just one. (The name of the mission was changed to NEAR-Shoemaker to honor the planetary geologist Eugene Shoemaker, who died in 1997.) The mission also was to be a model of efficiency: rather than roar to the target asteroid in one quick arc, the spacecraft would swing past the earth to get a gravitational boost. Along the way, NEAR-Shoemaker zipped through the asteroid belt and past Mathilde, a C asteroid.

Mathilde proved to be a bit of a surprise: a jagged, irregularly shaped 33-mile-wide body, darker than charcoal, was found to be only slightly denser than ice. Since the carbon-rich material that the asteroid is thought to be made of is far denser than this, planetary geologists believe Mathilde is nothing more than a gravel pile of primordial material loosely stuck together. But the fly-by of Mathilde was too fast to obtain detailed spectra.

NEAR-Shoemaker approached Eros in December 1999, and controllers sent the command that would slow it enough to be captured in an orbit. With so little gravitational pull (an astronaut on the surface could throw a rock fast enough to reach escape velocity) Eros was more of a point to maneuver about than a world to orbit. But at the very moment the spacecraft was supposed to settle into orbit around Eros, an engine failed to burn and the probe shot past.

That could well have been the end of the mission. But engineers found a way to correct the engine problem and re-aim the spacecraft. NEAR made an extra orbit of the sun so its path could be brought back to Eros 14 months later, on February 14, 2000.

Unprecedented Challenge

After settling into an orbit around the 21-mile-long, peanut-shape asteroid, NEAR-Shoemaker kept a careful distance. It was a matter of wise discretion, since orbiting such a strangely shaped object with such a tiny gravitational field was in itself an unprecedented challenge. And because of Eros’s bent and elongated shape and its rotation through a five hour and 15 minute “day,” the relative speed between spacecraft and asteroid ranged between two and 15 miles per hour, and was never the same from orbit to orbit. If ground controllers were not careful, the spacecraft could get whacked as the nose of the asteroid swung by.

For about two months, then, the spacecraft circled more than 100 miles above the surface, employing its camera, laser altimeter, magnetometer, infrared, and x-ray/gamma-ray detectors to obtain a comprehensive view of the end pointed to the sun. In mid-April the spacecraft moved inward, spending the next five months in orbits as low as 22 miles. Then, in August, ground controllers lifted NEAR-Shoemaker upward to a higher orbit so that scientists could get global views of the other end, now in daylight.

Of the many intriguing and distinct geological features spotted during this orbital reconnaissance, the most notable was the giant saddle-like feature. Data from the laser altimeter suggests that the feature is actually a crater, though strangely shaped. A more normal-looking large crater –– some three miles in diameter and a half-mile deep — dominates the asteroid’s other side.

Few Small Craters

Indeed, the size of the large craters gouged into Eros’s surface was perhaps less surprising than the absence of small ones. Unlike the moon and other solar system bodies –– where the relative number of differently sized craters remains constant as you get closer –– Eros lacks many craters less than 100 yards in diameter. “I am amazed at how devoid the surface is of small craters,” Veverka said.

Instead of small craters, investigators saw just the opposite: boulders everywhere, in all sizes and shapes. Some are rounded. Others have sharp angular facets. In fact, the entire surface of the asteroid seems covered with a layer of pulverized dust and debris of unknown depth. In some areas, such as in the large saddle, the layer appears thick enough to  completely blanket and fill older craters. The photographs also revealed grooves, troughs, pits, ridges and fractures, similar to what was seen on Ida.

“These are generally very old features, and suggest the existence of fractures in the deep interior,” says Veverka. The ridges, one of which wraps one-third the way around the asteroid, average about 30-feet high and 300-feet wide. Their existence suggests that Eros has an internal structure and is therefore a consolidated body and not a rubble pile like Mathilde. In other words, if you gave Eros a push, it would move away from you as a unit, rather than dissolve into a cloud of gravel.

The strangest features spotted by the close-up photos were what appeared to be extremely smooth ponds of material at the base of some craters, as if the dust and dirt on the crater slopes had flowed downward and pooled at the bottom. “Some process we don’t understand seems to sort out the really fine particles and move them into the lowest spots,” notes Veverka.

New Conclusions

Not only is Eros a solid hunk, close-up views reveal that its composition is remarkably uniform and evenly distributed. In fact, Eros appears incredibly bland, with little color variation anywhere on its surface. “The very small color differences lend support to Eros being all the same composition,” says the planetary scientist Clark Chapman of the Southwest Research Institute in Boulder, Colorado, and a member of the NEAR-Shoemaker science team.

That means the ground-based spectroscopy suggesting that Eros was a differentiated body –– with hemispheres composed of minerals that had separated due to melting –– was wrong. In fact, the data NEAR-Shoemaker has collected calls into question many of the conclusions that have been made about the composition of asteroids. Astronomers believed that Eros and all other S-type asteroids were geologically distinct from ordinary chondrite meteorites; on close inspection, NEAR has shown Eros to be nothing more than one large ordinary chondrite.

Many investigators now believe that such S asteroids –– which make up the majority of asteroids in the inner part of the solar system –– might well be the source of most meteorites. In fact, the difference in spectra between S asteroids and ordinary chondrites might be more a function of rotation than substance: as asteroids rotate, their irregular surface distorts their spectrum.

A Daring Finish

Rather than simply shut NEARShoemaker off, mission director Robert Farquhar suggested a more daring finish: Why not try to land the orbiter on the surface of Eros? Not only would such a landing enable investigators to get some high-resolution images that would have been impossible to obtain otherwise, the feat would teach ground controllers the best techniques for landing spacecraft on such low-gravity objects, a skill that future space navigators will surely need.

On its way down, NEAR-Shoemaker snapped 69 high-resolution images of Eros’ surface, resolving details less than an inch across. Just before impact, the last two pictures caught the edge of one of the sand ponds. Though the pond appeared smooth –– as in more distant photographs –– small stones were seen peeking up through the fine dust. Those final photographs raised more questions than they answered.

NEAR-Shoemaker recorded 160,000 photographs –– imaging surface features as small as a foot. It will take years for the investigators working on the mission to digest it all. Just as the VIKING missions to Mars informed the study of that planet for a generation, it may take decades before planetary scientists get a set of asteroid data that is richer or more detailed. Even so, NEAR-Shoemaker gave astronomers a wealth of data on just one asteroid. Whatever conclusions astronomers may draw from NEAR must be tempered with the knowledge that asteroids come in many sizes, shapes and compositions. Any definitive conclusions can be said only of Eros.

The First Close and Detailed Look at an Asteroid

Nonetheless, this first close and detailed look at an asteroid gave humanity its first tantalizing glimpse at the very earliest birth pangs of a planet. The flow of material down the slopes of craters, the crumbling of boulders, and the pooling of material into sand ponds are merely the processes by which an irregularly shaped object slowly rounds itself off into a spherical planet.

Ancient and worn by its billion-year journey through the black emptiness of space, Eros has slowly been chiseled by impact after impact, then shaped by the slow, inexorable pull of its tiny gravity. In this dim, dark and silent environment, nature has –– like the seed in an oyster from which pearls will grow –– relentlessly built Eros up from nothing. From a similar seed grew our earth.

As things stand now, however, the best summary of what we really know about Eros and asteroids comes from Veverka, who spoke freely at a press conference immediately after the landing. Again and again, Veverka told reporters, “We really don’t understand what’s going on.”

Also read:To Infinity: The New Age of Space Exploration

About the Author

Robert Zimmerman is author of Genesis, the Story of Apollo 8, published by Four Walls Eight Windows, and The Chronological Encyclopedia of Discoveries in Space, published by Oryx Pres.

Looking at Technology in the Classroom

A shot from a school/university computer lab with students working together.

A deep dive into the data around technology use in schools in the tri-state region. What do educators need to know?

Published September 1, 2001

By Allison L. C. de Cerreño, Ph.D., Mahmud Farooque, and My Linh H. Nguyen

Computer Availability for Students

TREND: Student to Computer Ratio Comes Down

In 2000, on a national basis, the number of students per instructional computer was 5, down from 9 in 1995. State averages for New York, New Jersey, and Connecticut ranged between 4.6 and 5.4.

UPSHOT: Not Down enough for Some

Disparities remain between the state averages and the averages for high-poverty schools in Connecticut and New York. Technology investment in Connecticut schools was derailed by budget cuts, and in New York it was well below recommendation. New Jersey made such significant investments in poor school districts that its high-poverty schools average 4 students per computer, while high-poverty schools in New York average 8.

Computer Use by Teachers

TREND: Computers are used more in Classrooms

Having computers in classrooms is a basic imperative. However, unless IT is integrated into teaching, the benefits are left unrealized. In 2000, 76 percent of all public schools reported more than half of their teachers were using computers in class. In the Tri-State area, Connecticut led with 72 percent, followed by New Jersey and New York at 69 percent and 68 percent, respectively.

UPSHOT: Except in Certain Schools

In computer use, Connecticut showed a huge gap between its schools with high percentages of historically underrepresented students (25%) and its state average (72%). Half of the teachers in Connecticut’s high-minority schools are “beginners” in technology use, while only one-third of low-minority schoolteachers are neophytes.

Internet Access

TREND: Most Schools are on the Internet

The Federal government’s efforts to transition America’s schools and libraries into the information age through initiatives such as the Technology Literacy Challenge Fund and the E-Rate—a program for obtaining discounted telecommunication services—produced great dividends. By 2000, 94% of schools nationwide had access to the Internet. Connecticut, at 96% connectivity, again led New Jersey and New York at 92% and 90%, respectively.

UPSHOT: Some are Left Behind

Despite an infusion of more than $600 million in E-Rate funding through March 2001, many New York schools remain without Internet access. 17% of high-poverty schools in New York are still not connected. Furthermore, of the rest, 65% access the Internet without the benefit of a high-speed connection compared to only 47% for low-poverty schools.

Investments for the Future: As Sales Plummet, Who Will Invest in R&D?

Information and electronics manufacturing and services accounted for more than two-thirds of total corporate R&D growth in 2000. In 1999, the IT industry spent nearly 10% of its sales in R&D.  Depleting sales means fewer R&D dollars available, which could significantly slow the rate of innovation in products and ser- vices. Although the public sector is likely to provide a stable source of revenue growth for the industry, very little R&D funding will come from state and local governments. Most Federal R&D will focus on basic and applied science, not product development.

Still, with increased concerns over security and law enforcement following the Sept. 11 attacks, IT applications in the areas of defense and healthcare, the Tri-State region’s top two sources of Federal R&D (see January 2001 issue), could see significant increases in the coming years.

Also read: Can the Public Sector Save IT?

Sources

  • Education Week, “The New Divides: Looking Beneath the Numbers to Reveal Digital Inequities” (May 10, 2001).
  • National Science Foundation, Survey of Industrial Research and Development, 1999.

The Economics of the Region’s Energy Consumption

A close up shot of the top of the powerlines, with a clean blue sky in the background.

An economic and usage analysis of utility consumption in the tri-state region as well as the potential impact of regulation on prices for residential consumers.

Published July 1, 2001

By Allison L. C. de Cerreño, Ph.D., Mahmud Farooque, and Veronica Hendrickson

Image courtesy of lkpro via stock.adobe.com.

Energy supply is not all that has become scarce in the utilities industry. There are fewer establishments and even fewer employees than there were a decade ago. In spite of this tapering of the labor market, sectoral output in the United States has gone up steadily, increasing by close to 15% between 1993 and 1999. The Tri-State region has followed the national pattern in reduction of workforce and rise in output. However, sectoral product grew rather slowly while there was a sharper decline in the employment base.

The greater loss in jobs is partly due to the fact that establishments in the region are larger than other parts of the country. Although the NY/NJ/CT region represented only 5% of the nation’s utility establishments in 1999, it accounted for 11% of the total employment and 13% of the annual payroll. Utility establishments in the Tri-State region employ on average nearly twice as many people as their counterparts in California; nearly four times as many as in Texas.

Unbundling of the electric utilities in the 1990s has made the sector more efficient and productive. However, unlike the cases in the airline and telecommunication industries, deregulation is yet to bring a dramatic reduction in the price of electricity, especially for residential customers

Water Utilities: Projections are Up, but Who Will Pay?

New regulation and improved technology have produced the opposite effect on the region’s employment in the water supply and sanitary services industries. An increase in the number of contaminants that must be monitored and treated has prompted the Bureau of Labor Statistics to project a 34% increase in employment between 1998 and 2008. However, the price tag for required maintenance and regulatory compliance for the region is hefty: about $25 billion for wastewater and $18 billion for drinking water, accounting for 18% and 13% of the United States’ totals respectively.

Energy Consumption in the Tri-State Region

Efficient

In 1999, 14% of the nation’s population resided in the NY/NJ/CT region but accounted for only 8% of the U.S.’s total energy consumption, a rather significant difference. Without the region, per capita energy consumption in the country would increase by more than 3%. Had the Tri-State region’s population consumed energy at the same rate as the rest of the U.S., the total energy usage would have increased by 3010 trillion Btu – more than the total energy consumed in Georgia that year.

Balanced…

Nationally, industrial demand led all other sectors in terms of energy consumption, accounting for 37% of the total energy consumed in 1999. Commercial demand, at 16% of the total, was the lowest of all four sectors. The pattern is similar to that of the Tri- State region, but some thirty years ago. Industrial sector’s share of the total energy pie has been decreasing steadily in the region. Today, each of the four sectors (industrial, commercial, residential and transportation) consumes about a quarter of the total energy.

However, these shifts have not been uniformly distributed across the region. For example, between 1993 and 1999, industrial demand in NY and CT rose by 23% and 5% respectively, but in NJ it dropped by 2%. This loss in industrial demand for energy was more than compensated by a 2.6% increase in the residential sector in a period when New Jersey saw its resident population increase by 3.4%.

And Environment-Friendly…

Coal provided 20% of the region’s total energy in 1960, a share that dropped to just 3% in 1999. Nationally, consumption of coal continued to hover around the 20% mark, remaining essentially unchanged in the last four decades. Share of natural gas in the NY/NJ/CT region doubled, while nationally, it experienced a 4% decrease from its 1960 levels. Nearly 83% of the total energy consumed in the U.S. came from just three sources: petroleum, natural gas and coal. By contrast, these three accounted for 73% of the total energy consumed in the region, with the remainder coming from hydroelectricity, nuclear, and other sources.

Also read: New York’s Power Woes and Deregulation’s Impact

Sources

  • United States Census Bureau, County Business Patterns, 1993-1999
  • United States Department of Commerce, Bureau of Economic Analysis, Gross State Product Data, 1993-1999.
  • United States Census Bureau, County Business Patterns, 1993-1999.
  • United States Environmental Protection Agency, 1999 Drinking Water Infrastructure Needs Survey.
  • United States Environmental Protection Agency, 1996 Clean Water Needs Survey.
  • United States Department of Energy, Energy Information Administration, State Energy Data Report, 1999.

New York’s Power Woes and Deregulation’s Impact

Powerlines in the foreground with a sunrise/sunset in the background.

Energy demands are on the rise in the tri-state region, and funding is more important than ever for the necessary infrastructure upgrades.

Published July 1, 2001

By Allison L. C. de Cerreño, Ph.D., Mahmud Farooque, and Veronica Hendrickson

Image courtesy of yelantsevv via stock.adobe.com.

In-State Generation

TREND: Increasing Demand, Dwindling Reserves

A generation reserve margin of 18% of peak load is recommended to ensure reliable and continuous power supply for NY. Peak demand has been rising at a rate between 1.2 to 1.4 percent per year while generation capacity has remained fixed at its 1999 levels.

IMPACT: More Dependence, More Problems

In-state reserve margins will shrink from a current 14.9% above peak to a dangerously low 8.4% by 2005 without any new generation. Electricity from out-of-state sources, currently at 3%, will have to make up the deficit, making NY’s power system vulnerable to meteorological, technological, financial and political uncertainties of neighboring regions. Out of commission dirtier in-state units and backup diesel generators will need to be brought back on-line, worsening the current levels of CO2, SO2 and NOx emissions.

Power Grid

TREND: Alone and Caught in the Red

Bureaucratic and political opposition has stalled construction as well as replacement of power lines in NY, leading to a near 10% reduction in circuit miles between 1993 and 1998. Unlike NJ and CT, which belong to regional transmission organizations, NY stands alone, and therefore, plans alone to mitigate its overloaded conditions.

IMPACT: At Capacity and Skating on Overload

Wholesale buying and selling of power requires complex, crisscrossing flows of electricity over long distances. Imported power from Canada is sent via one 300 kilometer 345kV line running from Marcy to New York City. It is at capacity 25% of the time and skating within 100 megawatts of overload for much of the rest. The blackout of 1965 resulted from the loss of a single 345kV line that routed power from Niagara to New York City.

New York City and Long Island

TREND: Demand Grows, Capacity Stays Constant

NYC and LI have become “load pockets”: areas where the import capability of the transmission system, together with the local generation capacity, is insufficient to meet electricity demand at all times. Local generation is required to be at a minimum 80% and 98% of the projected peak in NYC and LI respectively.

IMPACT: Need “In-city” and “On-island” Generation

Between 2001 and 2005 the peak demand will likely increase close to 6%. NYC and LI are running a current deficit of 397 and 131 MW respectively in local generation capacity, which would rise in the coming years unless new plants are built.

What Deregulation Promised: Industry Begins to Get Price Relief while Residents Wait

Deregulation of the airline industry in 1978 brought dramatic reductions in airfare. Between 1980 and 1990, average passenger fares fell by 28%. Unbundling of the local telephone service from long-distance in 1982 also triggered increased competition in the telecommunications industry and drastic reduction in price.

Deregulation of the electric utility industry, initiated through the 1992 Energy Policy Act, is beginning to bring significant rate reductions for industrial customers, though not so much so for residential customers, particularly in the Tri-State region. Between 1993 and 1999, average price for electricity in the region in current dollars dropped by 13.7% for industrial customers but increased by 0.6% for residential customers.

Also read: The Economics of the Region’s Energy Consumption

Sources

  • Edison Electric Institute, Statistical Year Book, 1993-2000; New York Independent System Operator, Power Alert: New York’s Energy Crossroads, March 2001
  • Bureau of Transportation Statistics, National Transportation Statistics, 2000; Energy Information Administration, Electric Power Annuals, 1993-1999
  • Federal Communications Commission, Trends in Telephone Service, 2000

The Collective Approach to Harnessing Technology

A hand-drawn illustration of a woman smiling.

Efforts like the Academy’s Technology in Economic Development initiative aims to advance economic development in the tri-stat region through technology.

Published March 1, 2000

By Fred Moreno, Anne de León, and Jennifer Tang

If, as the saying goes, two heads are better than one, imagine the potential for getting things done that 1,079 companies can have—all focused on advancing New Jersey as a leading technology center. As members of the New Jersey Technology Council (NJTC), these companies share the unwavering commitment of Maxine Ballen to the efficacy of cooperative action.

“We can get more done collectively than individually,” says Ballen. After years of working with high-tech companies on an individual basis, she founded the NJTC in 1996 “to provide networking opportunities, information, and other services to foster the growth of the state’s technology businesses.”

It’s easy to see why Ballen’s role in The New York Academy of Sciences’ (the Academy’s) Technology in Economic Development (TED) project is a good fit. The focus of the TED project, a five-year effort made possible by a grant from the Starr Foundation, is not unlike that of NJTC. With TED, the Academy aims to create a leadership network that will promote rising global competitiveness in the tri-state region through technology-led economic growth. The rationale for the project? The collective assets of the region comprise a far more attractive lure to potential investors than the assets of any individual state.

Lessons for Successful Economic Development

Moreover, Academy studies of global trends during the 1990s revealed “lessons” for successful economic development—which the region is not yet applying.

The TED project has two goals: serve as a mechanism for regularly gathering leaders from industry, academe, and government sectors to create opportunities for improved economic strategies; and develop and share information that can lead to action by tracing trends in science and technology related to economic development.

Asked by the Academy to organize workshops to examine the relationships between universities and industry and workforce development, Ballen did what comes naturally: she pulled together many of the major players in New Jersey.

“We need to show the rest of the country that this is a high-tech region,” Ballen says. “I applaud the Academy for taking the leadership in doing so.”

Also read: The Economics of Transportation and Communications